AMC8 1993
AMC8 1993 · Q10
AMC8 1993 · Q10. It mainly tests Rounding & estimation, Patterns & sequences (misc).
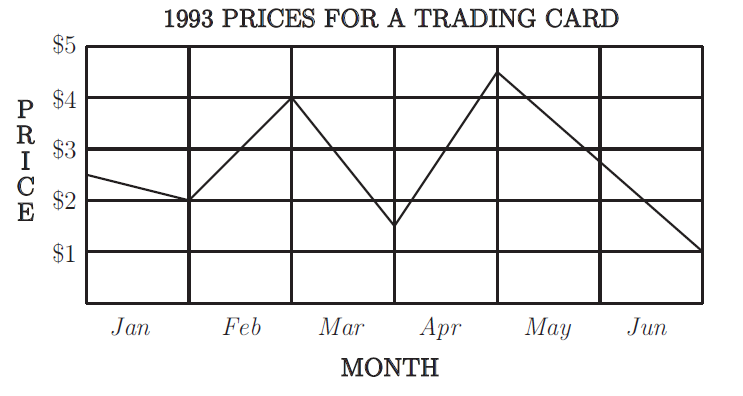
This line graph represents the price of a trading card during the first 6 months of 1993.
这条线图表示了 1993 年前 6 个月一张交易卡的价格。
(A)
January
一月
(B)
March
三月
(C)
April
四月
(D)
May
五月
(E)
June
六月
Answer
Correct choice: (B)
正确答案:(B)
Solution
Answer (B): The graph shows the following changes in the price of the card:
\[
\begin{array}{lll}
\textit{Jan}: & \$2.50 \text{ to } \$2.00 & \textbf{drop\ of\ } \$0.50 \\
\textit{Feb}: & \$2.00 \text{ to } \$4.00 & \textbf{rise\ of\ } \$2.00 \\
\textit{Mar}: & \$4.00 \text{ to } \$1.50 & \textbf{drop\ of\ } \$2.50 \\
\textit{Apr}: & \$1.50 \text{ to } \$4.50 & \textbf{rise\ of\ } \$3.00 \\
\textit{May}: & \$4.50 \text{ to } \$3.00 & \textbf{drop\ of\ } \$1.50 \\
\textit{Jun}: & \$3.00 \text{ to } \$1.00 & \textbf{drop\ of\ } \$2.00 \\
\end{array}
\]
The greatest drop occurred during March.
答案(B):该图表显示卡片价格的以下变化:
\[
\begin{array}{lll}
\textit{1月}: & \$2.50 \text{ 到 } \$2.00 & \textbf{下降\ } \$0.50 \\
\textit{2月}: & \$2.00 \text{ 到 } \$4.00 & \textbf{上升\ } \$2.00 \\
\textit{3月}: & \$4.00 \text{ 到 } \$1.50 & \textbf{下降\ } \$2.50 \\
\textit{4月}: & \$1.50 \text{ 到 } \$4.50 & \textbf{上升\ } \$3.00 \\
\textit{5月}: & \$4.50 \text{ 到 } \$3.00 & \textbf{下降\ } \$1.50 \\
\textit{6月}: & \$3.00 \text{ 到 } \$1.00 & \textbf{下降\ } \$2.00 \\
\end{array}
\]
最大跌幅发生在3月。
Topics
Related Questions
Practice full AMC exams on amcdrill.
Try full-length practice and diagnostics at www.amcdrill.com.