AMC8 1993
AMC8 1993 · Q5
AMC8 1993 · Q5. It mainly tests Averages (mean), Area & perimeter.
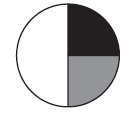
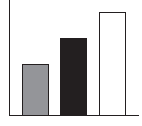
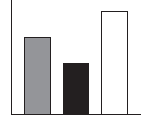
Which one of the following bar graphs could represent the data from the circle graph?
以下哪个条形图可能代表圆图中的数据?
(A)
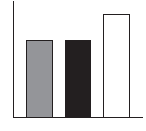
(B)
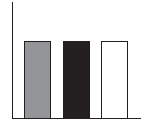
(C)
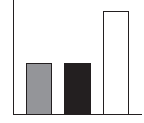
(D)
(E)
Answer
Correct choice: (C)
正确答案:(C)
Solution
The unshaded area is half the total, and each of the shaded areas is one fourth of the total. This is represented in bar graph (C).
未着色区域占总面积的一半,着色区域各占总面积的四分之一。这在条形图(C)中表现出来。
Topics
Related Questions
Practice full AMC exams on amcdrill.
Try full-length practice and diagnostics at www.amcdrill.com.